Skip to main content
Utility navigation
Home
About
Contact
FAQ
Enter keyword or phrase
Search
Advanced Search >
Toggle navigation
Main navigation
Mott Poll Reports
Infographics
In the News
Academic Publications
Blog
Infographics
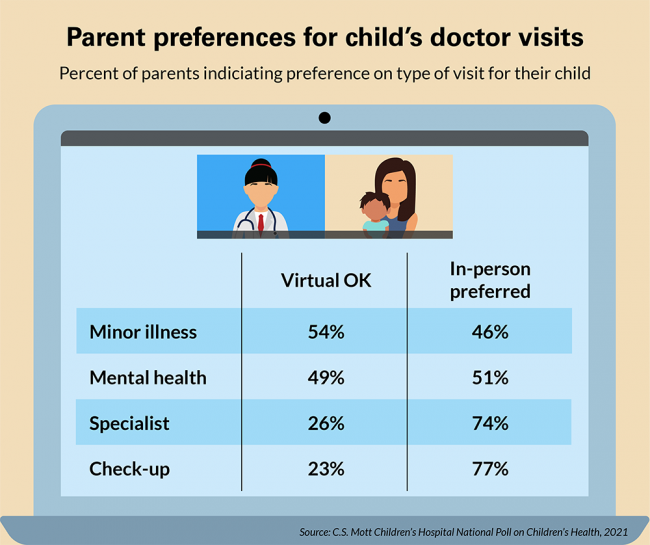
Virtual visits for kids
May 17, 2021
Read the Full Report >
Download Infographic:
051721_VirtualVisits.png
See More Like This:
COVID-19
Doctor Visits
Share Infographic: